The release of CrowdSec v1.1.x introduces new package repositories for the CrowdSec agent and the bouncers, making the setup process even easier. In addition to that, multiple CrowdSec agents can be connected to the console to get a unified view of the attackers.
In this tutorial, we are going to cover the following:
- CrowdSec setup
- Testing detection capabilities
- Bouncer set up
- Observability
- Console Preview
CrowdSec setup
Prerequisites
For demonstration purposes ahead, we’ll install Apache2 to get some logs.
sudo apt install apache2 -yor
sudo yum install httpdInstall CrowdSec
For Debian/Ubuntu:
Add the repositories:
curl -s https://install.crowdsec.net/ | sudo bashInstall:
sudo apt-get install crowdsec -yFor CentOS/Red Hat Enterprise Linux:
Add the repositories:
curl -s https://packagecloud.io/install/repositories/crowdsec/crowdsec/script.rpm.sh | sudo bashInstall:
sudo dnf install crowdsecDuring installation, CrowdSec will detect Apache2 and install the required collection. Let’s verify that:
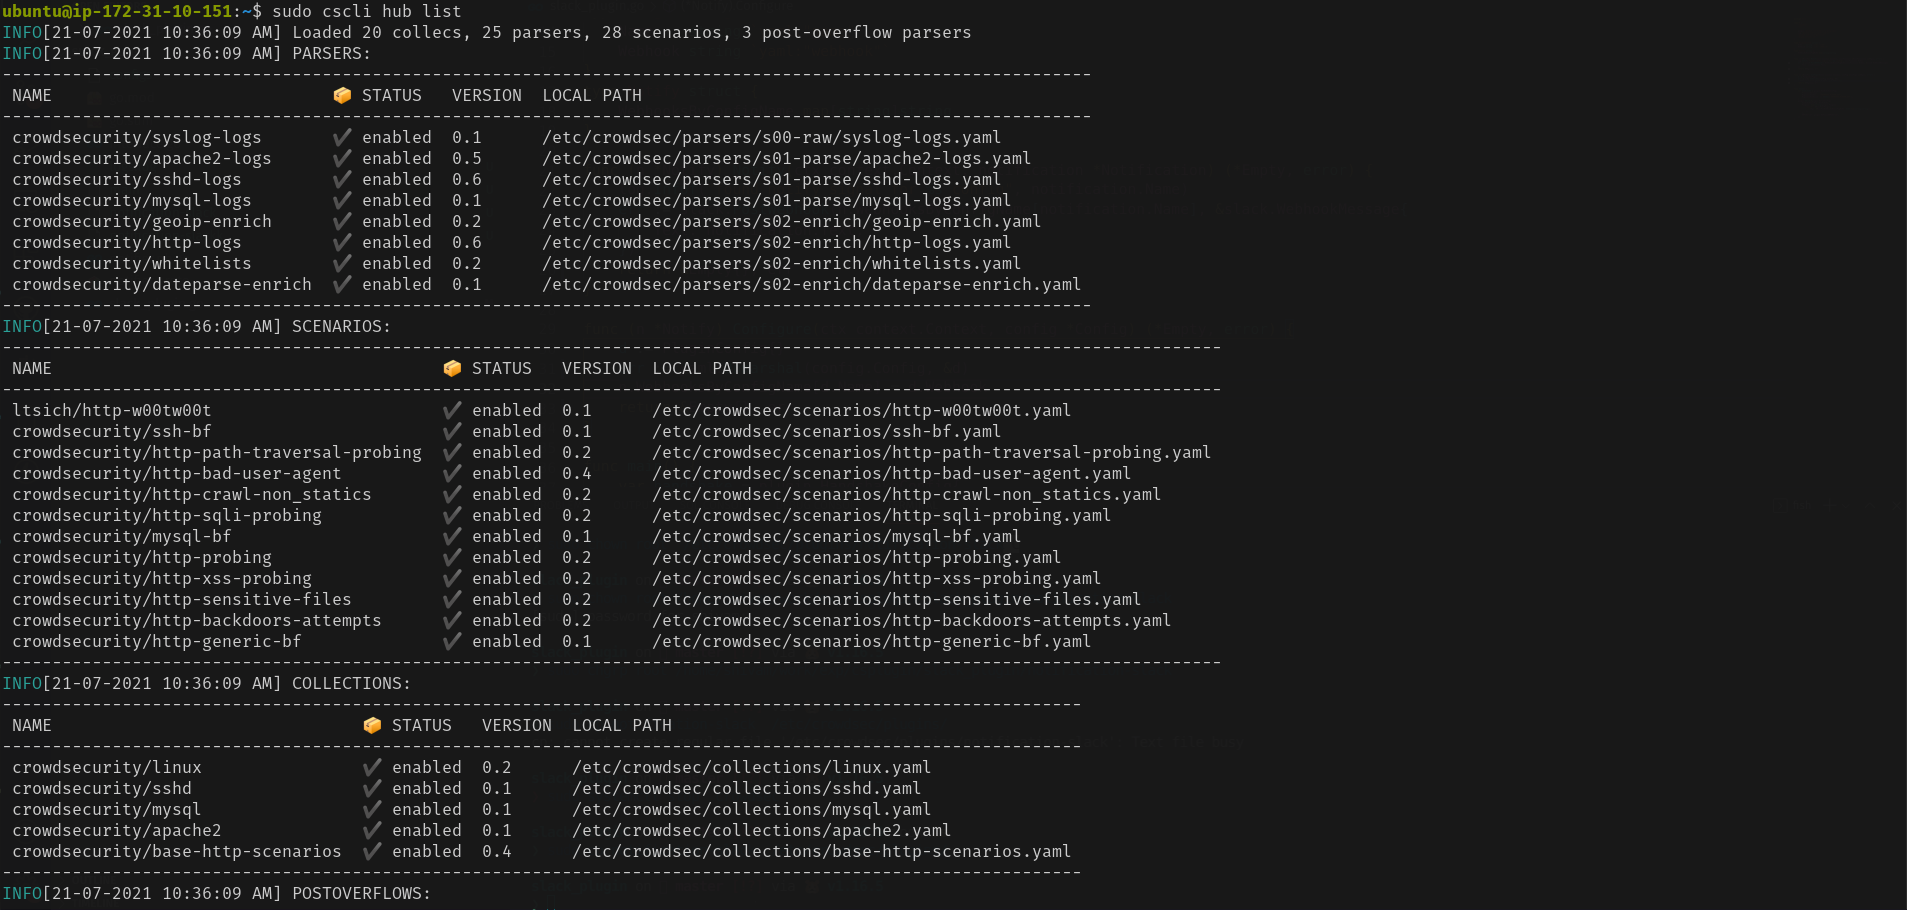
A collection is a set of configurations that allow CrowdSec to protect the given service. For example, the crowdsecurity/sshd collection contains a parser for SSHD logs and a scenario to detect SSH bruteforce and SSH user enumeration.
If you install new services after this, you can update CrowdSec to install the required collections via:
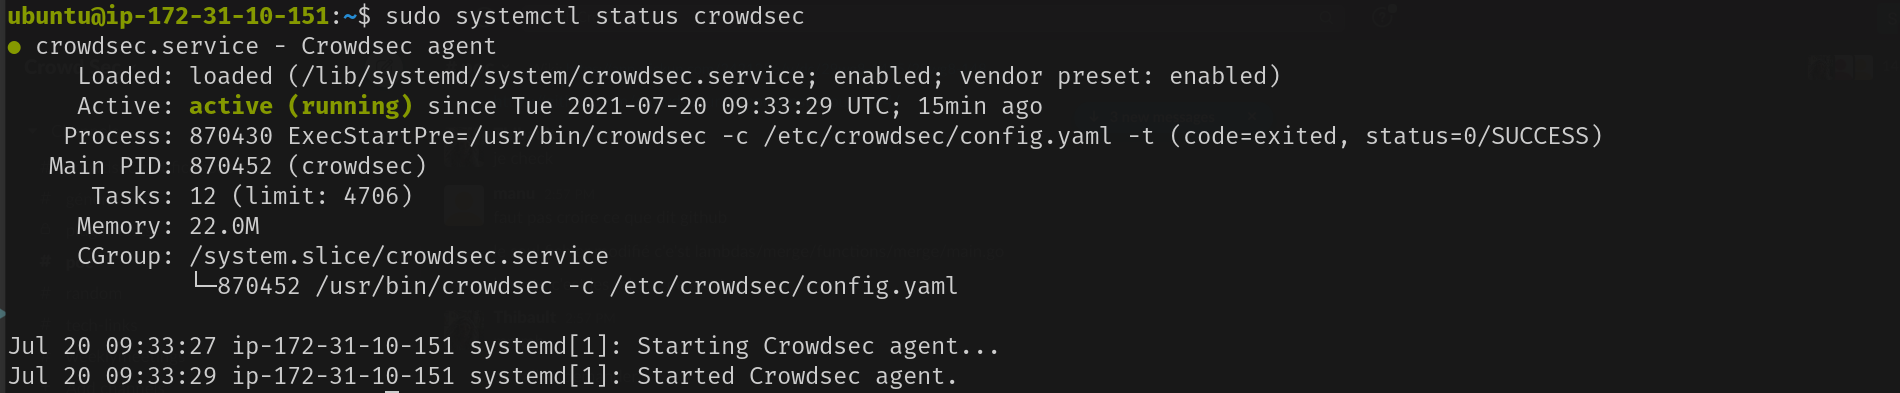
/usr/share/crowdsec/wizard.sh -cVerify your installation:
Testing detection capabilities
Now, let’s simulate a web application vulnerability scan on our Apache service using Wapiti, a web application vulnerability scanner. You will need to do this from an external IP, while bearing in mind that private IPs are whitelisted by default.
ATTACKER$ wapiti -u http://34.248.33.108/[*] Saving scan state, please wait...Note
========
This scan has been saved in the file
/home/admin/.wapiti/scans/34.248.33.108_folder_b753f4f6.db
...
On our freshly equipped machine, we can see the attacks in the logs:
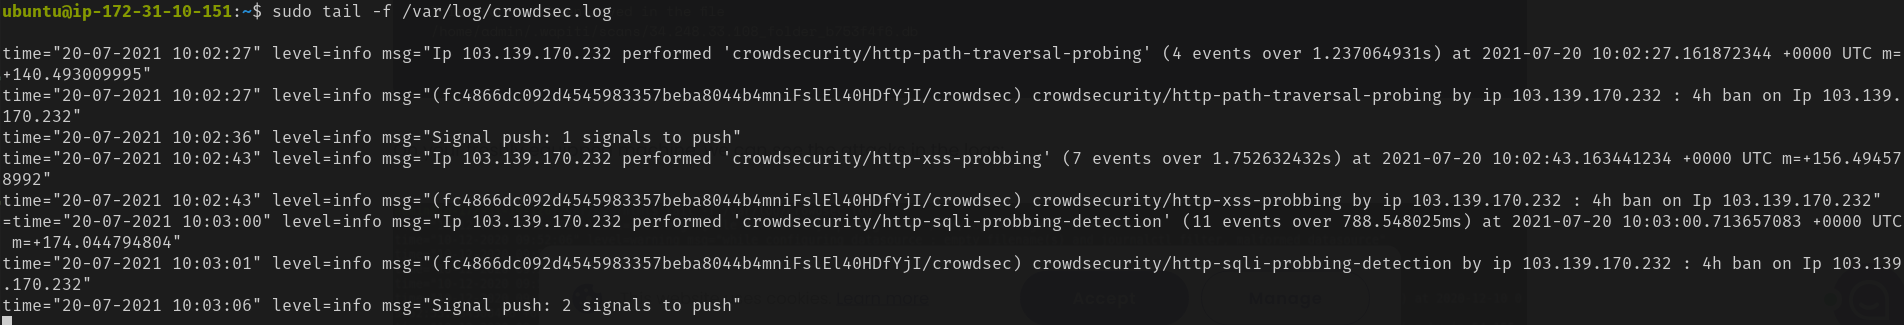
Don’t forget that the website we attacked here is an empty Apache server. In the case of a real website, the scanner would perform many other actions that would lead to more detections.
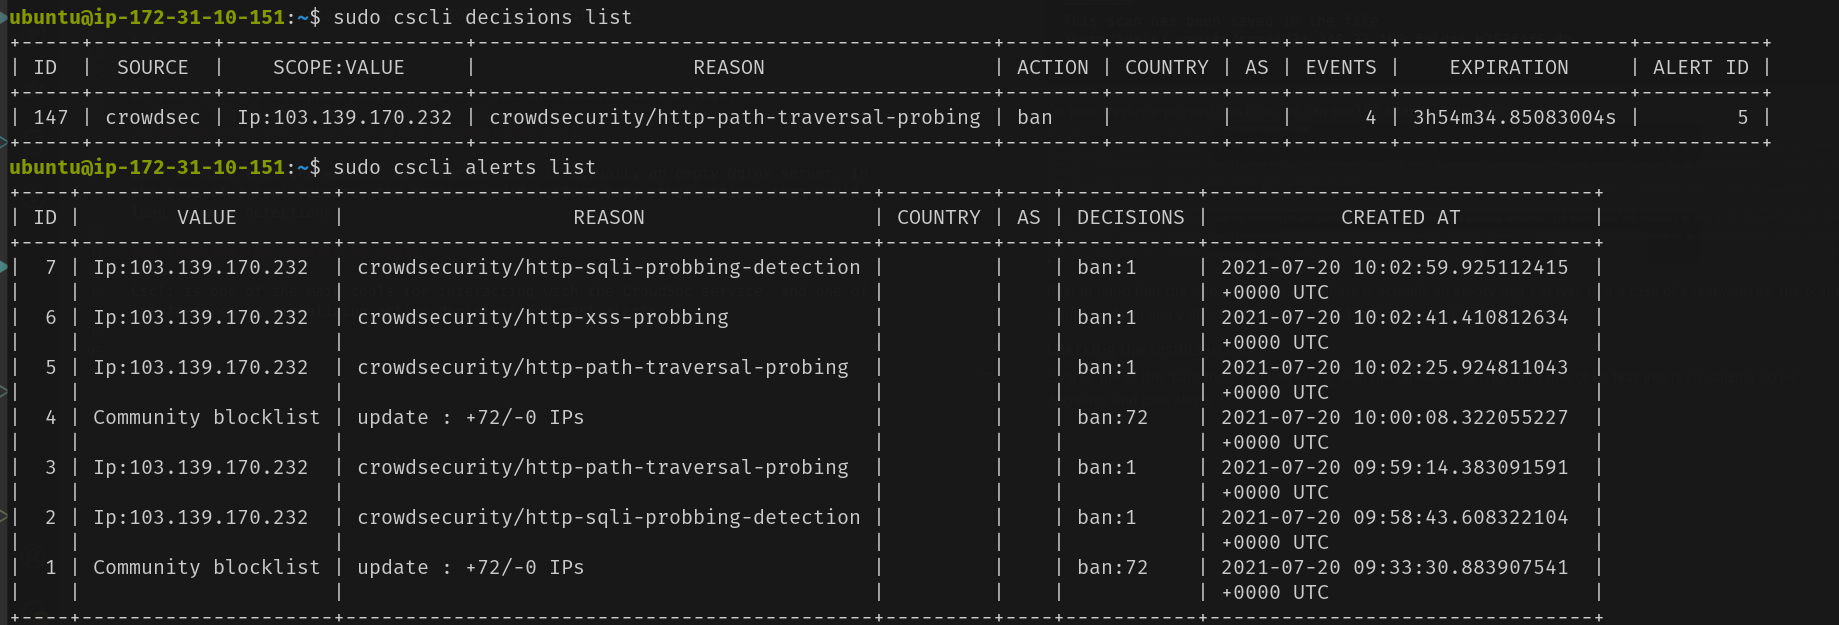
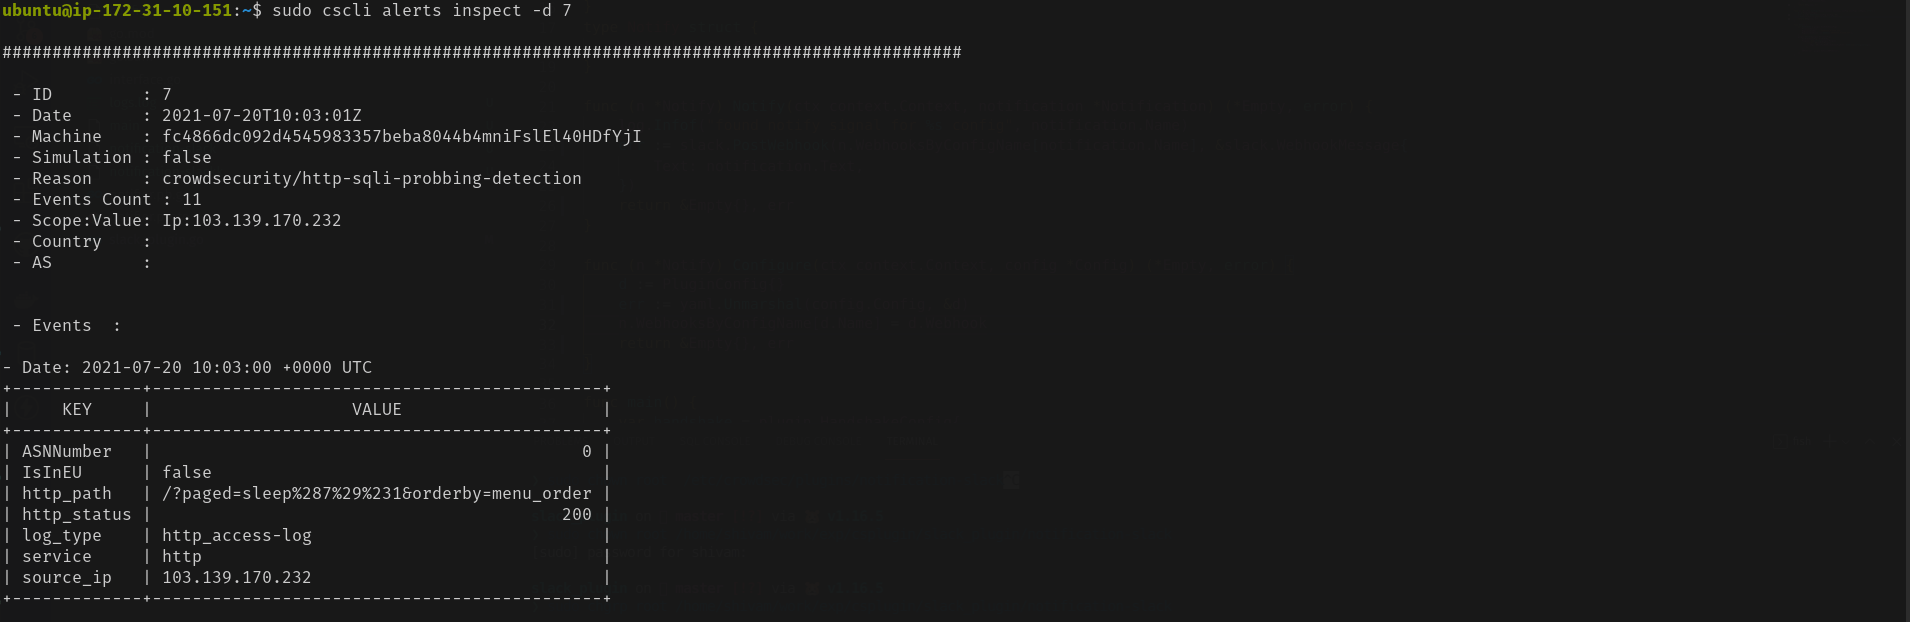
Checking the results in cscli
Cscli is one of the main tools for interacting with the CrowdSec service, and one of its features, among many others to interact and inspect the CrowdSec service, is visualizing active decisions and past alerts.
Defend attacks with bouncers
CrowdSec’s detection capabilities provide observability on what is going on. However, to protect yourself, you need to block attackers, which is where bouncers play a major part. Remember: CrowdSec detects, bouncers deter.
Bouncers work by querying CrowdSec’s API to know when to block an IP. You can download them directly from the CrowdSec Hub.
In this example, let’s use the cs-firewall-bouncer. It directly bans any malevolent IP at the firewall level using iptables or nftable. We’ll be using nftable.
Installing the bouncer
The cs-firewall-bouncer is available in the CrowdSec repositories we added before.
For Debian/Ubuntu:
sudo apt install crowdsec-firewall-bouncer-nftables crowdsec-firewall-bouncerFor CentOS/Red Hat Enterprise Linux:
sudo dnf install crowdsec-firewall-bouncer-nftablesCheck whether the bouncer is registered properly with CrowdSec:

Testing the bouncer
Warning: Before going further, ensure you have another available IP to access your machine so that you don’t ban yourself. Using your smartphone’s internet connection will work. Now that you have a bouncer to protect yourself, try the test again.
Run the Wapiti scanner like before via:
ATTACKER$ wapiti -u http://34.248.33.108/After the scan is complete check accessing the server, from the attacker’s machine:
ATTACKER$ curl --connect-timeout 1 http://15.206.212.189/
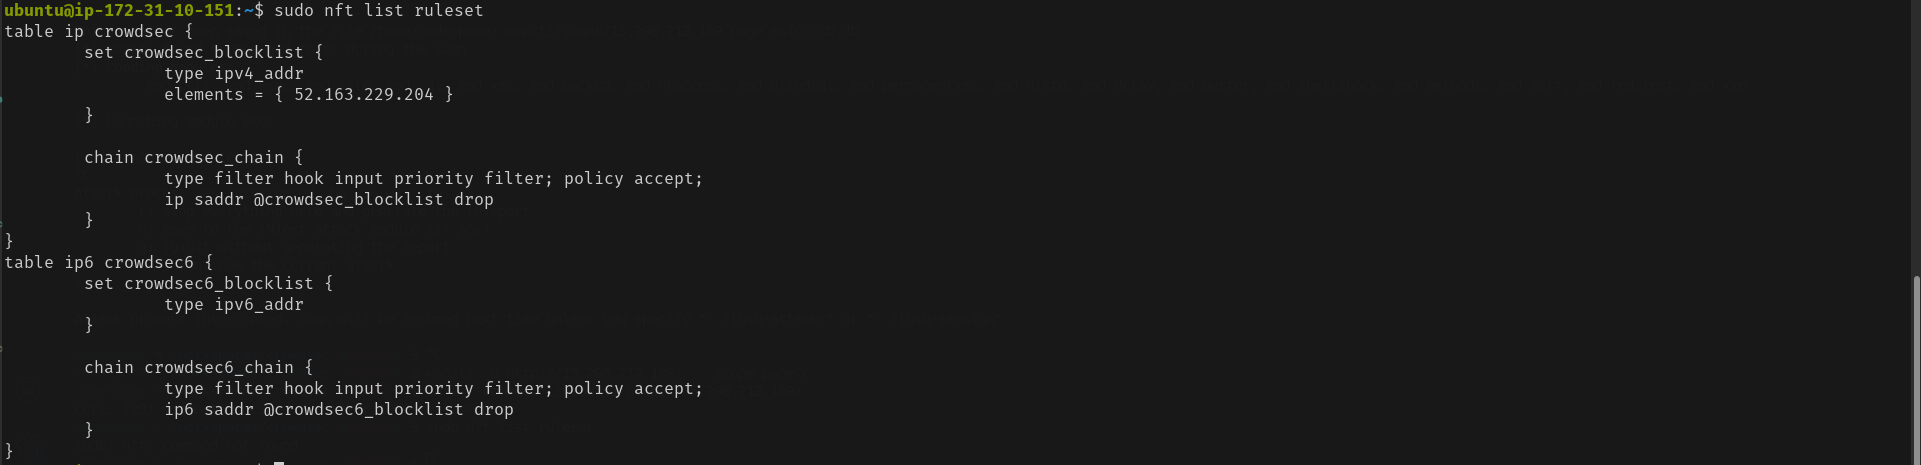
curl: (28) Connection timed out after 1000 millisecondsFor the technically curious, the cs-firewall-bouncer uses either Nftables or Iptables. Using Nftables (used on Debian 10 by default) creates and maintains two tables named CrowdSec and CrowdSec6 (for IPv4 and IPv6 respectively).
You can change the firewall backend used by the bouncer in /etc/crowdsec/bouncers/crowdsec-firewall-bouncer.yaml by changing the mode from nftables to iptables (ipset is required for iptables mode).
Observability
Observability (especially for software that might take defensive countermeasures) is always a key point for a security solution. Besides its “tail the logfile” capability, CrowdSec offers two ways to achieve this: Metabase dashboards, and Prometheus metrics.
Using Metabase
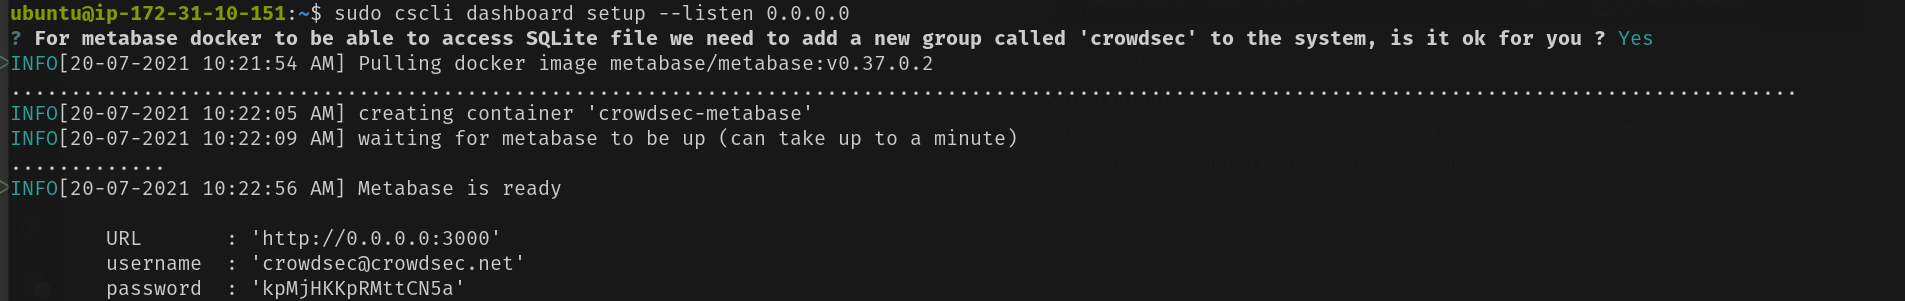
Cscli allows you to deploy Metabase using Docker. Begin by installing Docker using its official documentation. Be sure to expose/forward port 3000 to access your dashboard.
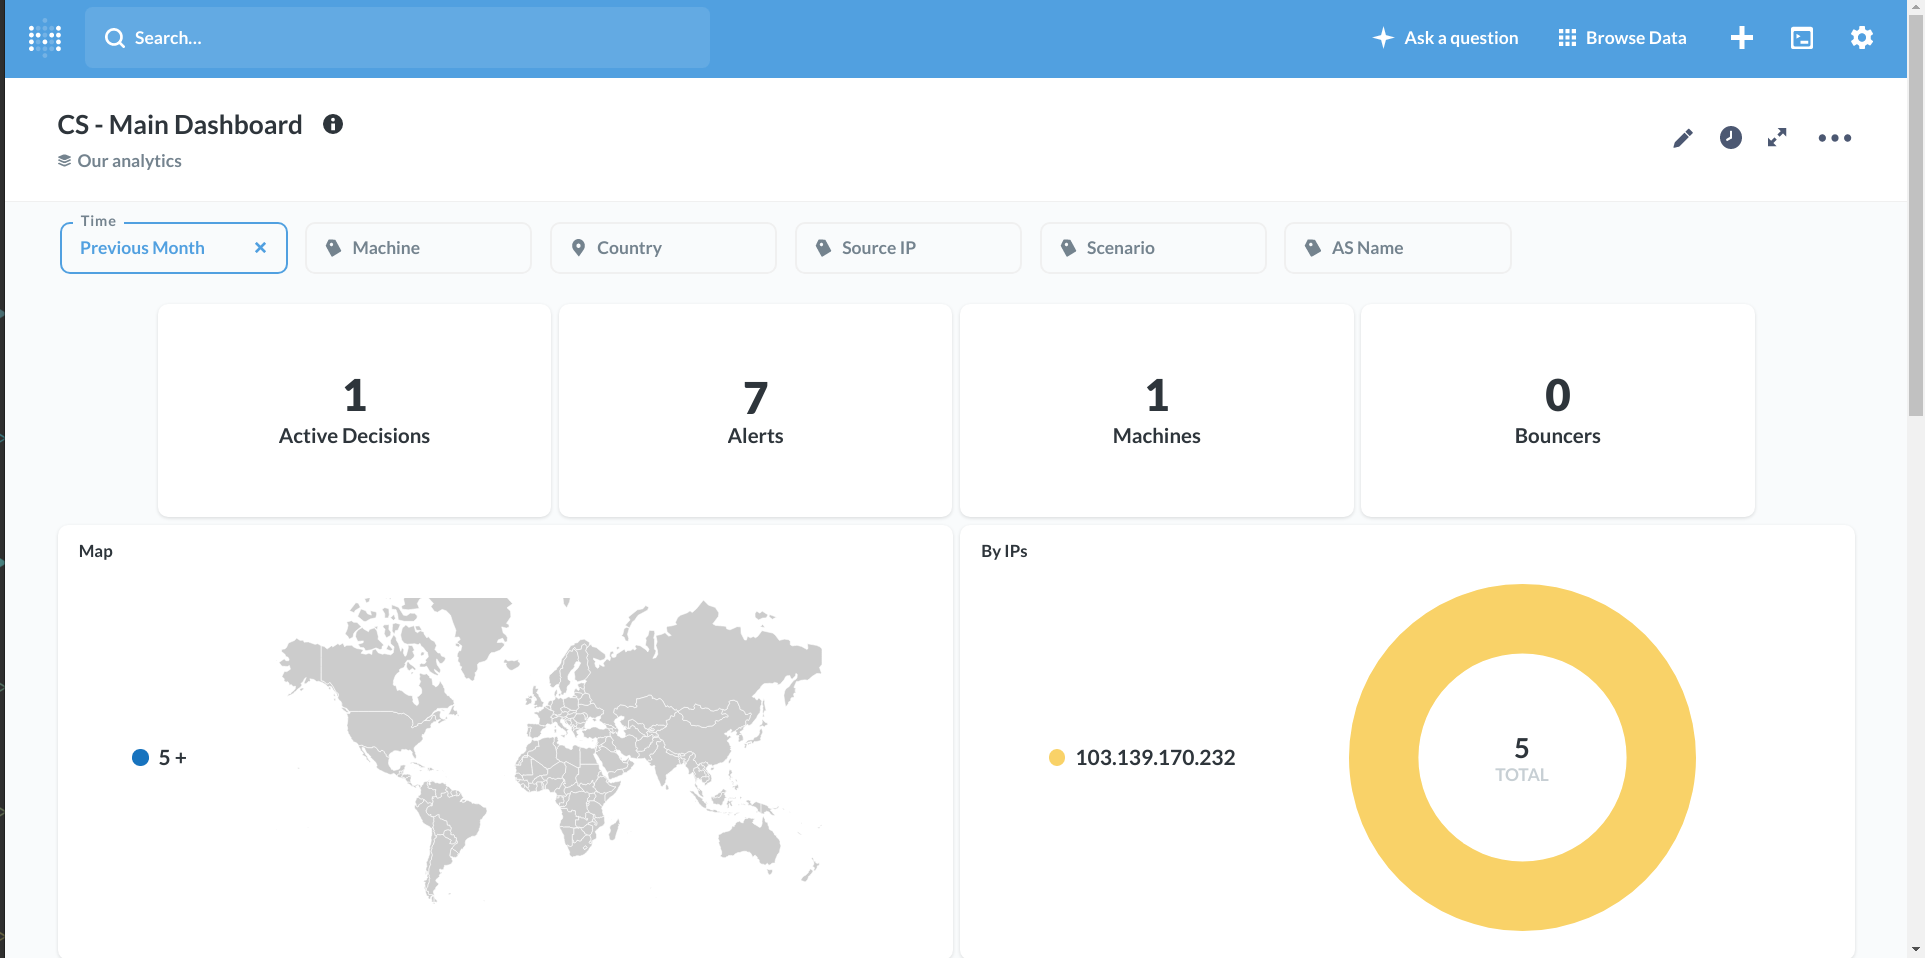
You can now log in to Metabase using the generated credentials.
Prometheus metrics
While some people love visual dashboards, others prefer different kinds of metrics. This is where CrowdSec’s Prometheus integration comes into play. One way to visualize these metrics is with cscli metrics:
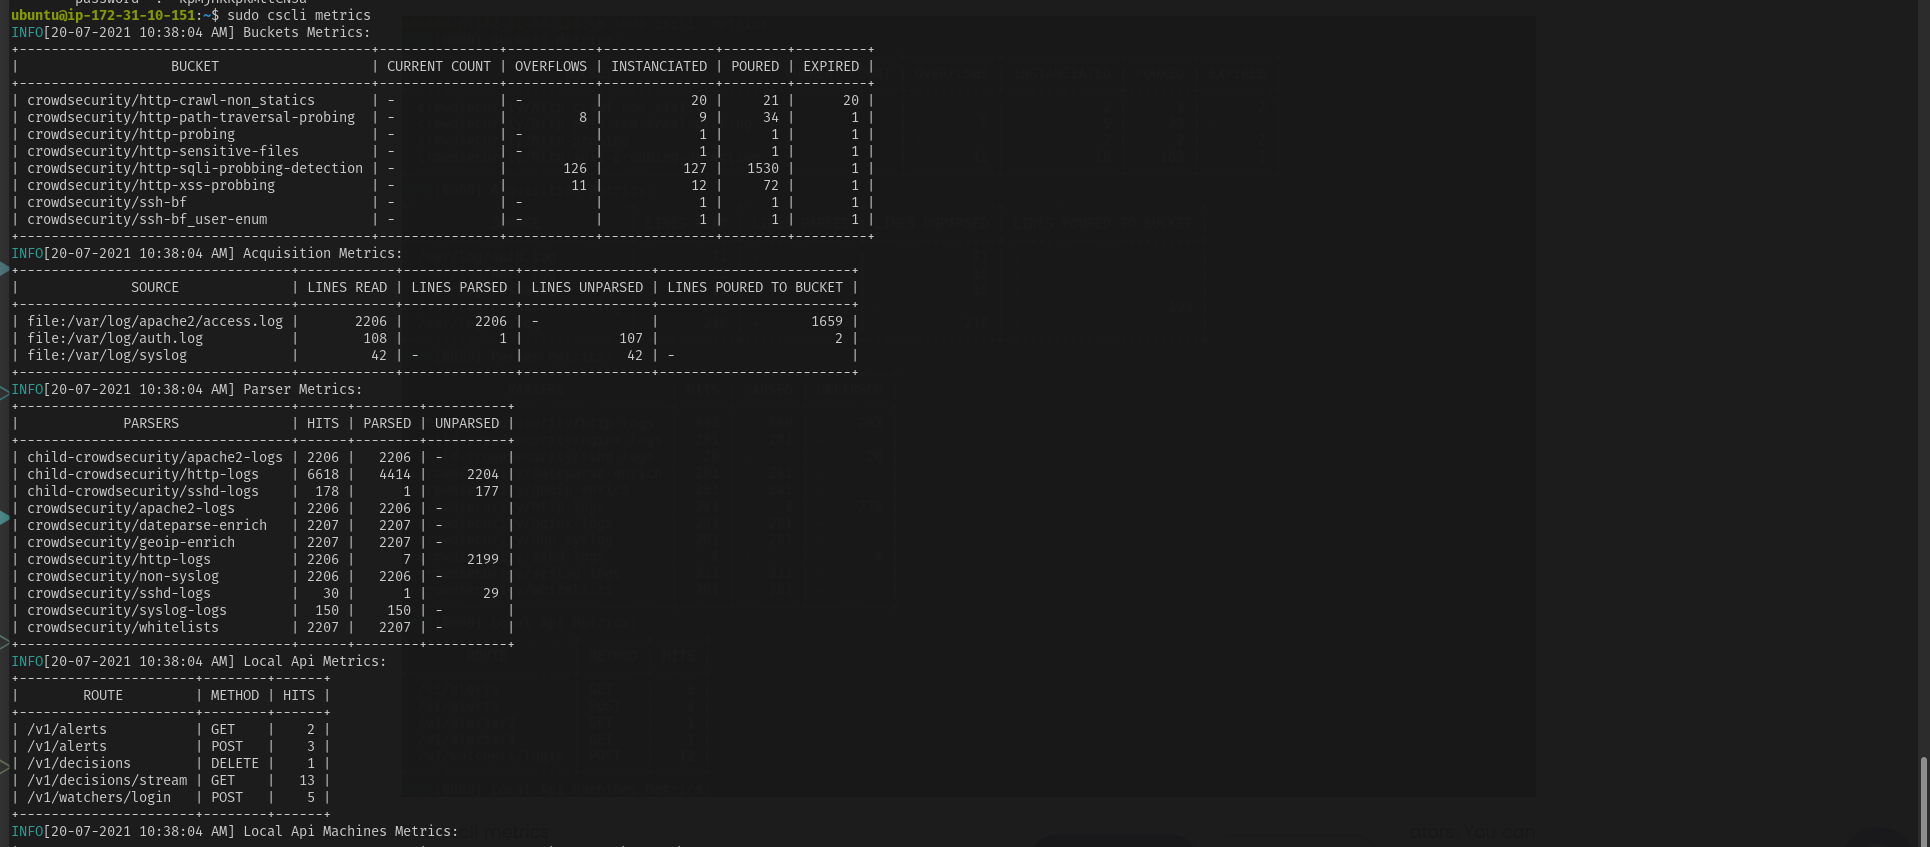
The cscli metrics command exposes only a subset of Prometheus metrics that are important for system administrators. You can find a detailed description of the metrics in the documentation. The metrics are split into various sections:
- Buckets: How many buckets of each type were created, poured or have overflowed since the daemon startup?
- Acquisition: How many lines or events were read from each of the specified – sources, and were they parsed and/or poured into buckets later
- Parser: How many lines/events were delivered to each parser, and did the parser – succeed in processing the mentioned events?
- Local API: How many times was each route hit and so on?
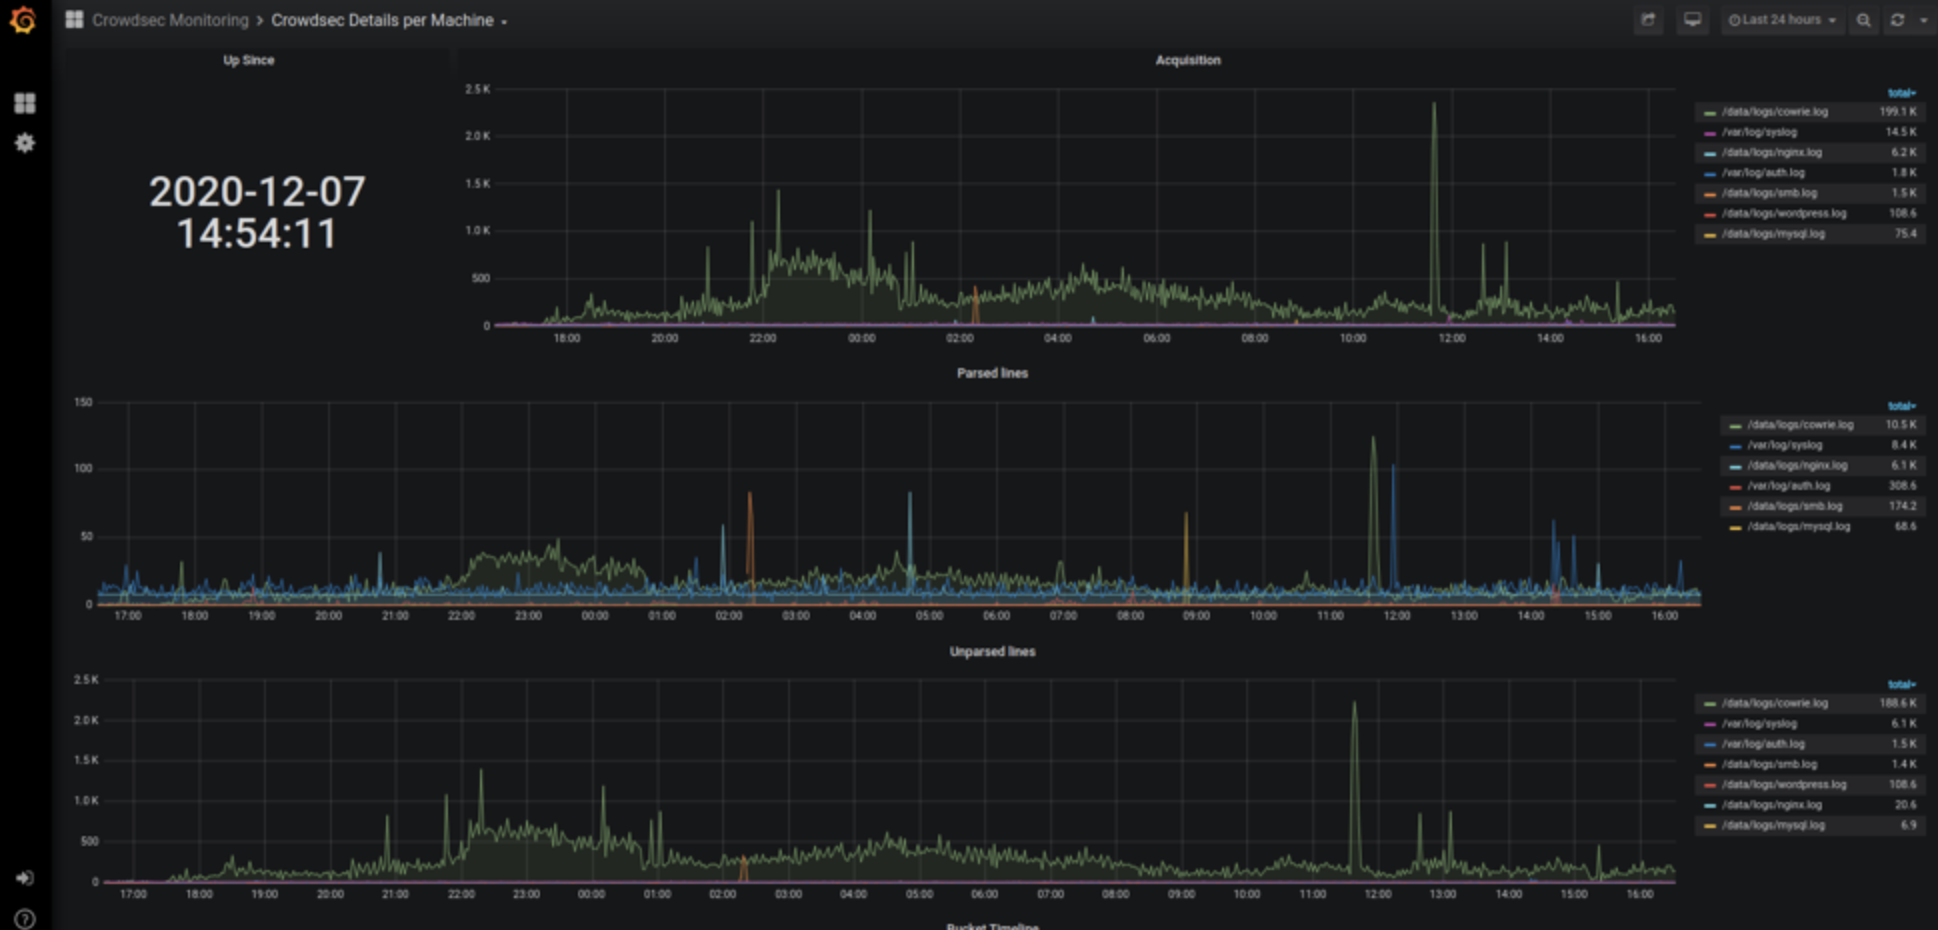
Viewing Crowdsec’s Prometheus metrics via cscli metrics is more convenient but doesn’t do justice to Prometheus. It is out of scope for this article to deep dive into Prometheus, but these screenshots offer a quick look at what CrowdSec’s Prometheus metrics look like in Grafana.
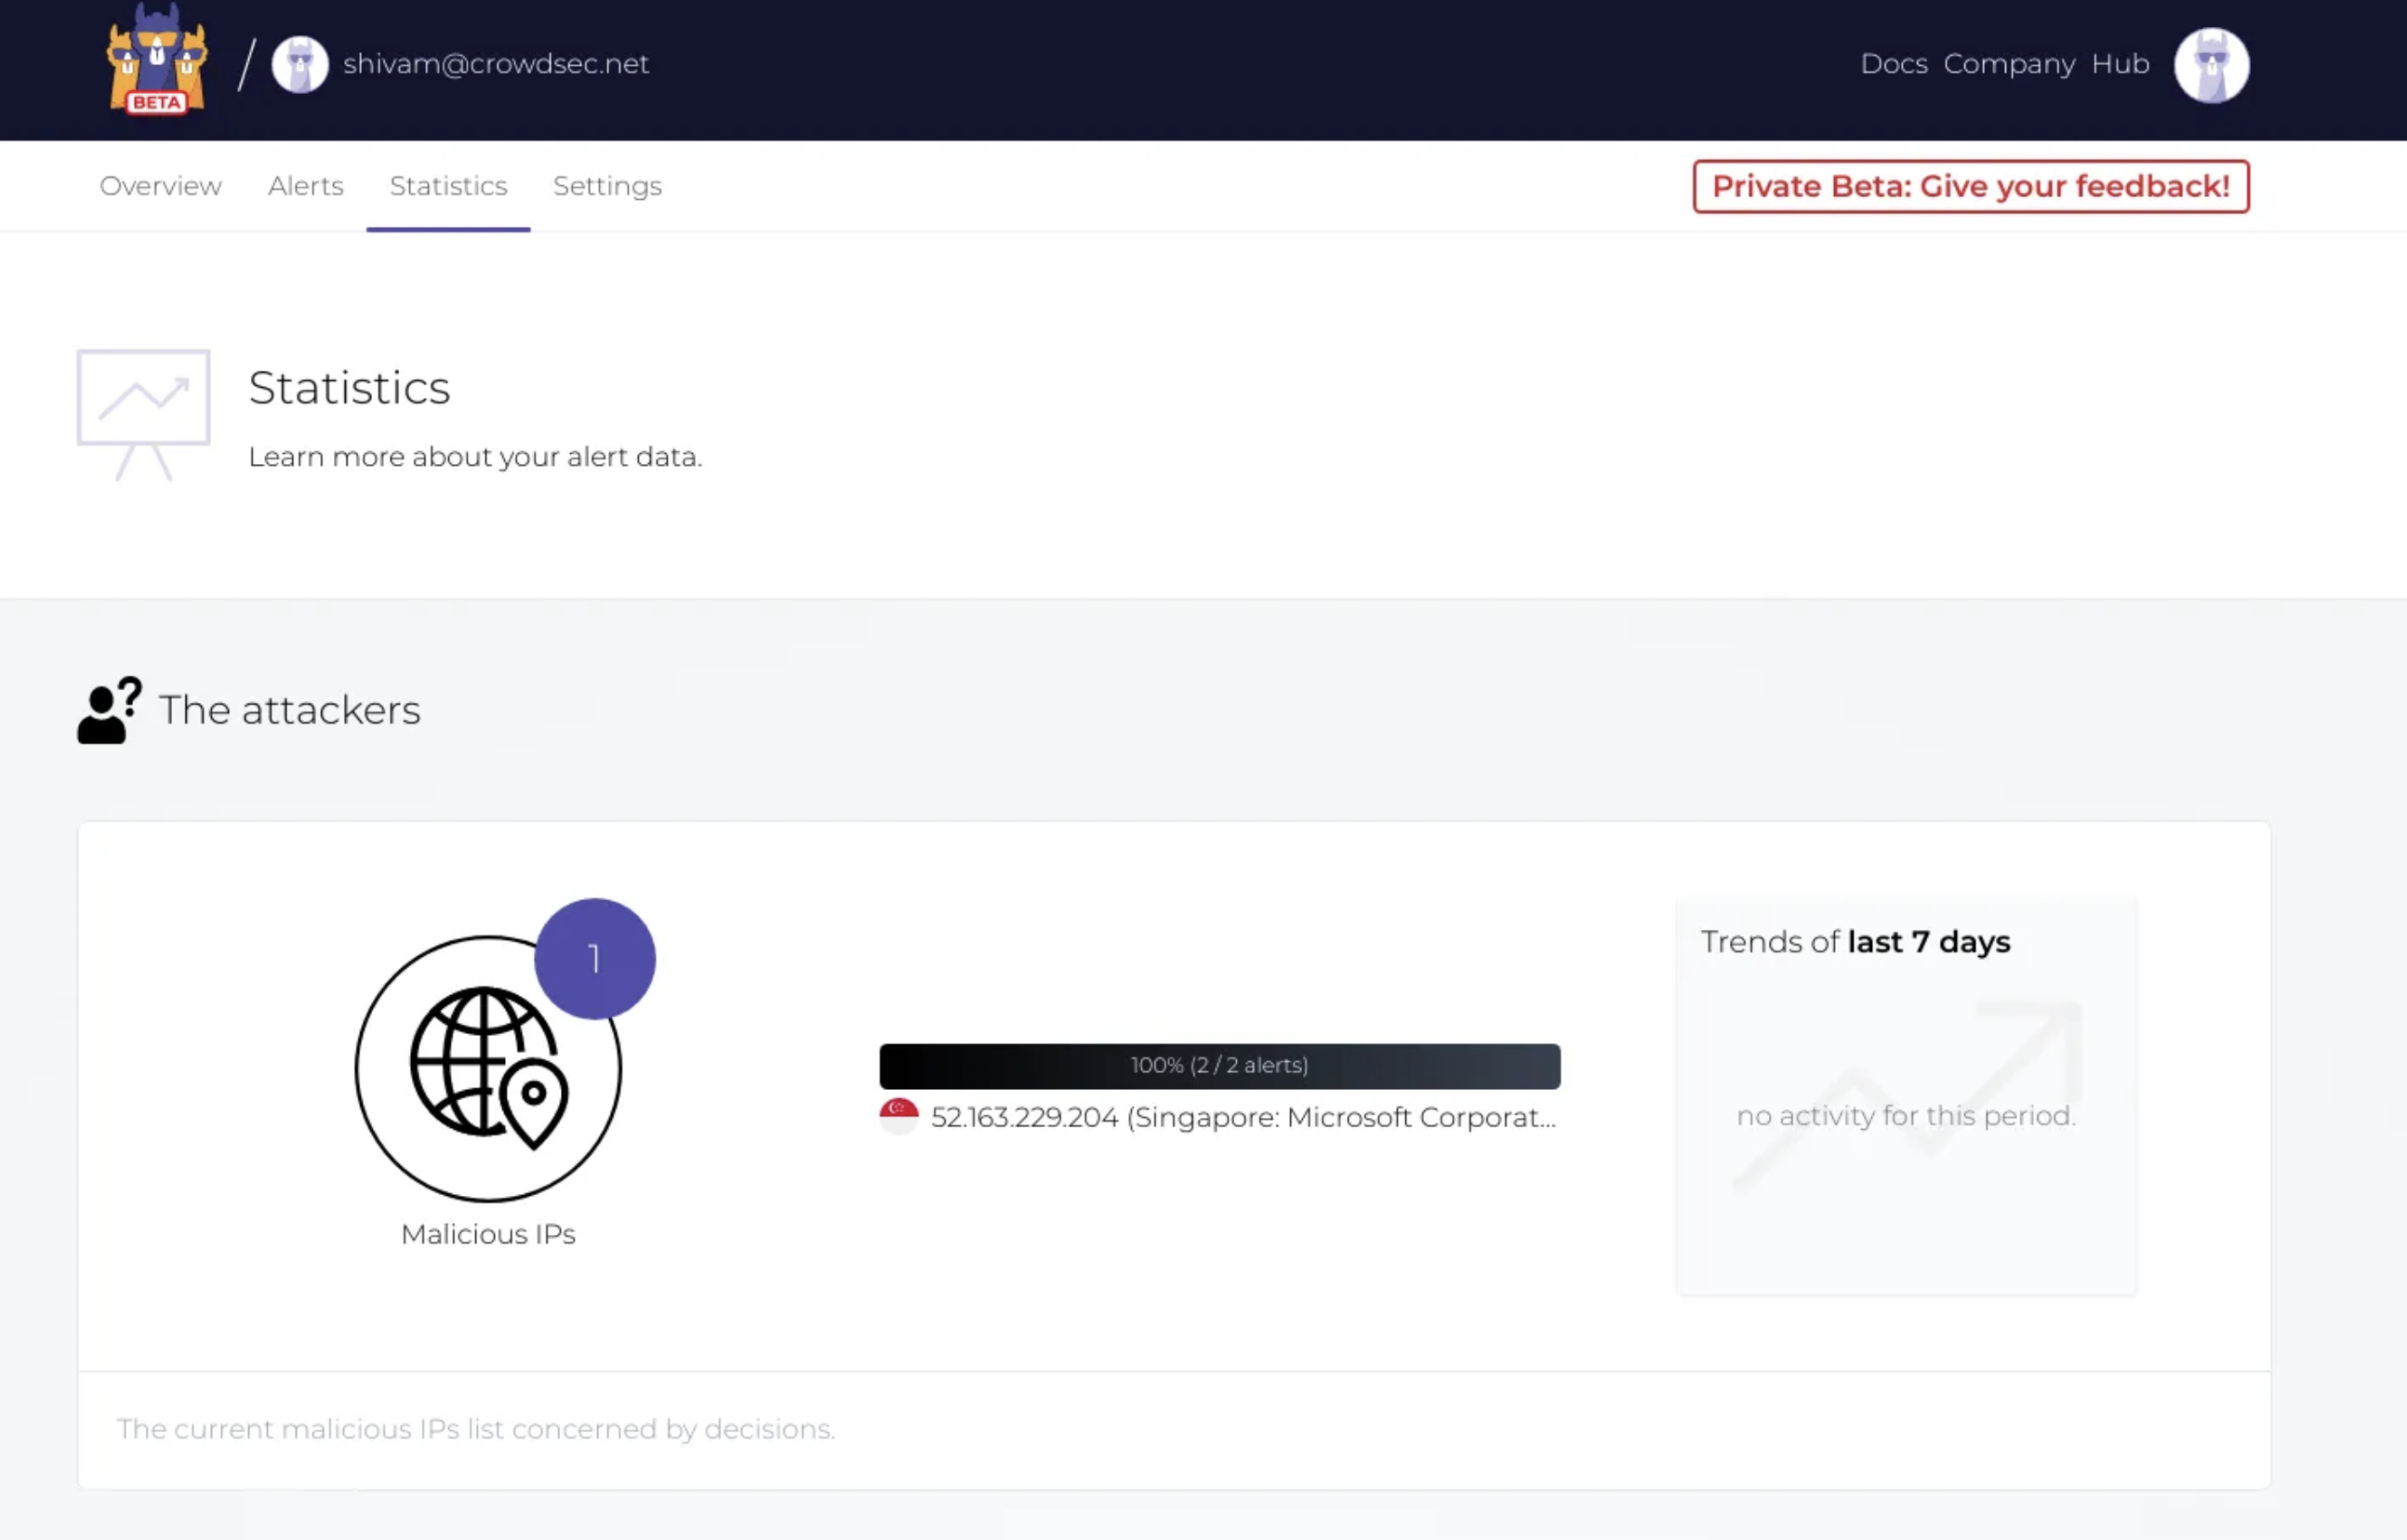
Enrolling to the CrowdSec Console
The console provides an easy-to-use web interface to inspect multiple CrowdSec agents spread across different networks.
To test it, create a console account. After signing in, follow the instructions to enroll the CrowdSec agent. After the initial synchronization, you can view alerts and related statistics in the web interface.

Get involved
We would love to hear your feedback about this latest release. If you are interested in testing the software or would like to get in touch with the team, drop by our Gitter channel.